Software Features

Software is included with the Grid Analyzers

Software Features

Deformation Browser, TTT, Polka Dot, Thinning analysis, and more...

circle grid analysis,forming limit diagram, FLC,forming severity,surface strain circle grid analysis,forming limit diagram, FLC,forming severity,surface strain,deformation;tool and die,stress limit diagram, forming limit diagram, FLC,forming severity,surface strain,stress limit diagram,square grid analysis,rolling direction,strain of sheet metal forming limit diagram, FLC,forming severity,surface strain,stress limit diagram,rolling direction,strain of sheet metal,analysis of deformation,strain analysis report forming limit diagram, FLC,forming severity,surface strain,stress limit diagram,rolling direction,strain of sheet metal,analysis of deformation,strain analysis report,Thinning ReportIncremental Grid Analysis,forming limit diagram, FLC,forming severity,surface strain,stress limit diagram,rolling direction,strain of sheet metal,analysis of deformation,strain analysis report surface strain,stress limit diagram,strain of sheet metal,analysis of deformation,strain analysis report forming limit diagram, FLC,forming severity,surface strain,stress limit diagram,rolling direction,strain of sheet metal,analysis of deformation,strain analysis report Polka Dot Grid,forming limit diagram, FLC,forming severity,surface strain,stress limit diagram,rolling direction,strain of sheet metal,analysis of deformation,strain analysis report

Grid Analyzers

Automatic surface strain measurement

Circle Grid Analysis

Automatic hollow circle grid measurement with manual override

Square Grid Analysis

Automatic hollow sqaure grid measurement with manual override

Customary Report

Customary report including all measured strains, date and time stamp, FLD, material data and more...

Thinning Report

FLC expressed in the major-minor strains or thickness -minor strains coordinates

Incemental Grid Analysist

Customary report including all measured strain date, time stamp, FLD and material data

Fracture Stiching

Stitching function allows measurement of the fracture strains

Deformation Browser

Our unique Deformation Browser software tool designed for die tryout applications

Polka Dot Grid

The Polka Dot grid option provide a quick and accurate single grid element measurement of grids used by some 3D systems.

circle grid analysis,forming limit diagram, FLC,forming severity,surface strain circle grid analysis,forming limit diagram, FLC,forming severity,surface strain,deformation;tool and die,stress limit diagram, forming limit diagram, FLC,forming severity,surface strain,stress limit diagram,square grid analysis,rolling direction,strain of sheet metal Incremental Grid Analysis,forming limit diagram, FLC,forming severity,surface strain,stress limit diagram,rolling direction,strain of sheet metal,analysis of deformation,strain analysis report surface strain,stress limit diagram,strain of sheet metal,analysis of deformation,strain analysis report forming limit diagram, FLC,forming severity,surface strain,stress limit diagram,rolling direction,strain of sheet metal,analysis of deformation,strain analysis report,Thinning Report forming limit diagram, FLC,forming severity,surface strain,stress limit diagram,rolling direction,strain of sheet metal,analysis of deformation,strain analysis report forming limit diagram, FLC,forming severity,surface strain,stress limit diagram,rolling direction,strain of sheet metal,analysis of deformation,strain analysis report Polka Dot Grid,forming limit diagram, FLC,forming severity,surface strain,stress limit diagram,rolling direction,strain of sheet metal,analysis of deformation,strain analysis report
themed object
"Forming Measurement Tool Inovations"
get in touch

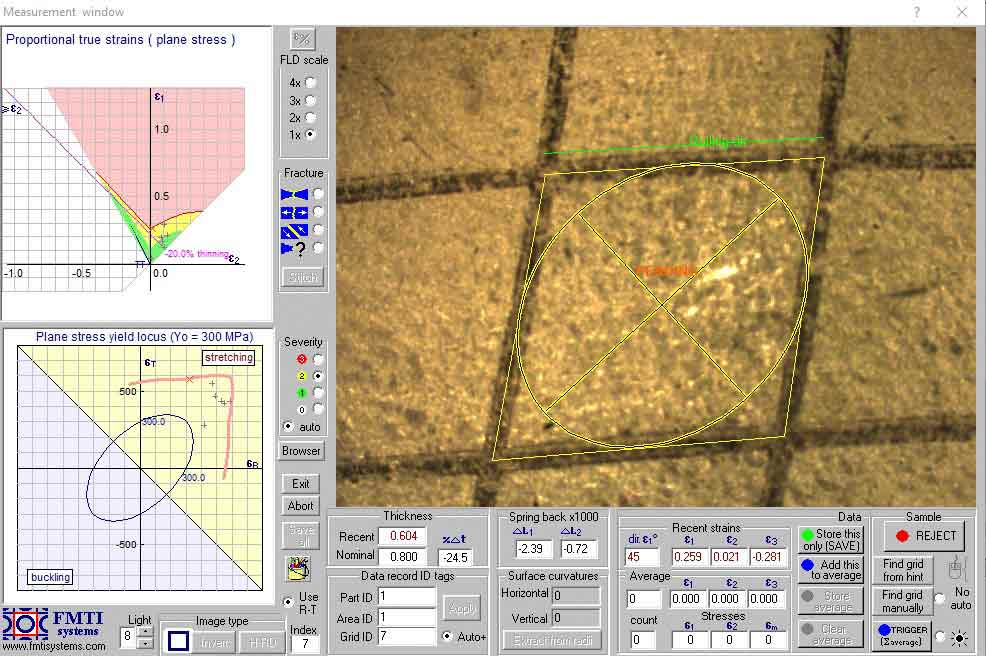
Circle Grid Analysis (CGA)

circle grid analysis,forming limit diagram, FLC,forming severity,surface strain,deformation;tool and die,stress limit diagram,

Our Grid Analyzers automate circle grid strain measurement that has traditionally been measured with Maylar tape. Automation increases accuracy while reducing time and reduces eye strain. Circle grids give a direct visual indication of the principal directions of deformation, but provide less accurate measurements than square or polka dot grids. The rolling direction of the sheet, cannot be associated with the circle grids and therefore the directions of deformation are unavailable. Circle Grid cannot be used to analyze multiple-operation processes.

Square Grid Analysis (SGA)

Square Grid Analysis

Square grids are more accurate than circle grids. The square grid can be aligned with the rolling direction of the sheet and the deformation directions can be referred to in relation to the directionality of the material. For best accuracy square grids may be used with the TTT program to analyze deformation in multiple-operation processes. Square grids cannot be used with Maylar tape and lack direct visual indication of the principal directions of deformation.

Incremental Grid Analysis (TTT)

Incremental Grid Analysis,forming limit diagram, FLC,forming severity,surface strain,stress limit diagram,rolling direction,strain of sheet metal,analysis of deformation,strain analysis report,Tick Tack Toe

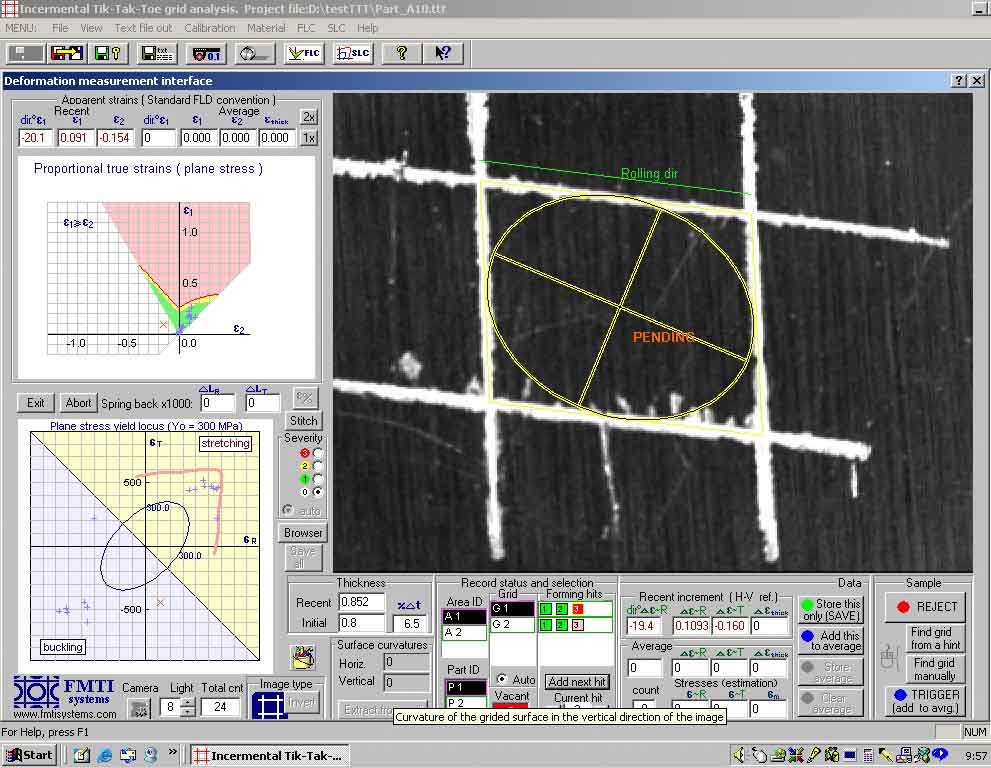
FMTI Systems pioneered the development of the grid analysis technique for multiple operation processes, such as progressive die forming, transfer press forming, and tube hydoforming with pre-form. The main difficulty in the analysis of multiple operation processes is that the conventional concepts of major-minor strains and the forming limit diagram, FLD produce ambiguous results. For example, during a hydroforming process of shaping a tubular member, with the tube being pre-formed by bending, the grid elements located at the inner surface of the bend are initially compressed and shortened. Our incremental deformation analysis application, TTT, employs square grids or grids drawn hand.

Stitching

surface strain,stress limit diagram,strain of sheet metal,analysis of deformation,strain analysis report

The grid analyzer provides the grid stitching function, which allows measurement of the fracture strains and tracking the fracture type: necking, normal rupture or shear. The grid stitching function removes the fracture gap running through the grid element before the strain measurements are performed on the digital image of the grid.
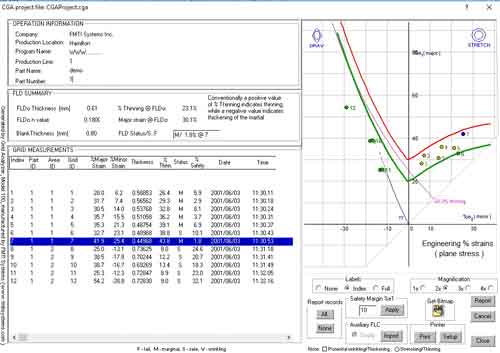
Strain Report

forming limit diagram, FLC,forming severity,surface strain,stress limit diagram,rolling direction,strain of sheet metal,analysis of deformation,strain analysis report

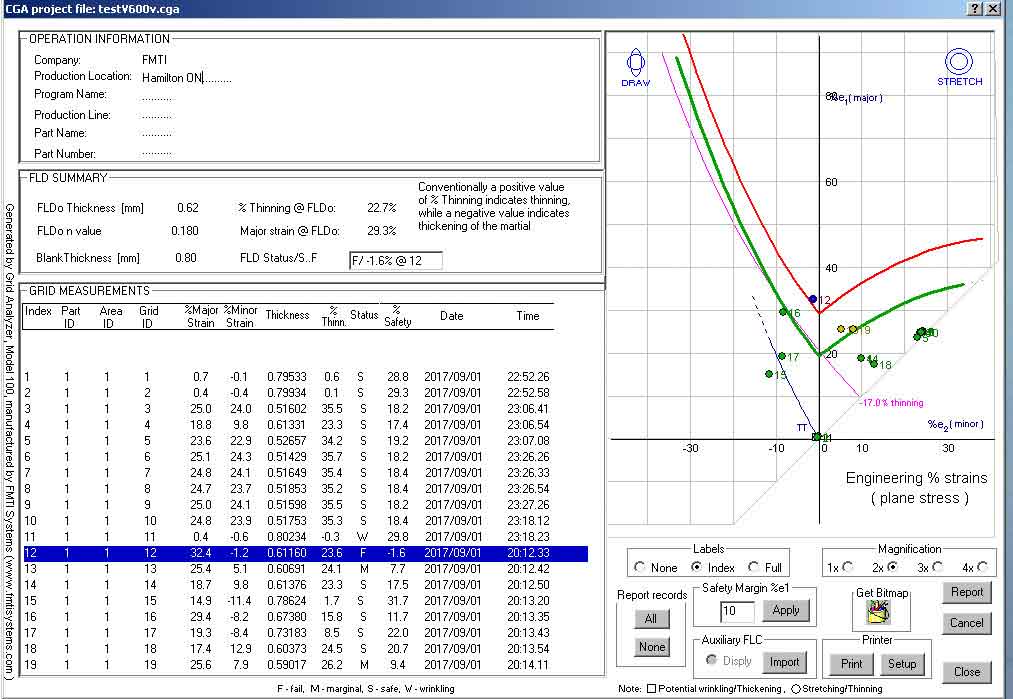
The Strain Analysis Report page is provided in either customary or scientific formats. The customary report option generates the strain analysis report page in a format based on the procedures currently used in the automotive and steel industries. The customary forming limit diagram, FLD, provides a plot of the strains with reference to the forming limit curve, FLC.

Thinning Report

forming limit diagram, FLC,forming severity,surface strain,stress limit diagram,rolling direction,strain of sheet metal,analysis of deformation,strain analysis report,Thinning Report

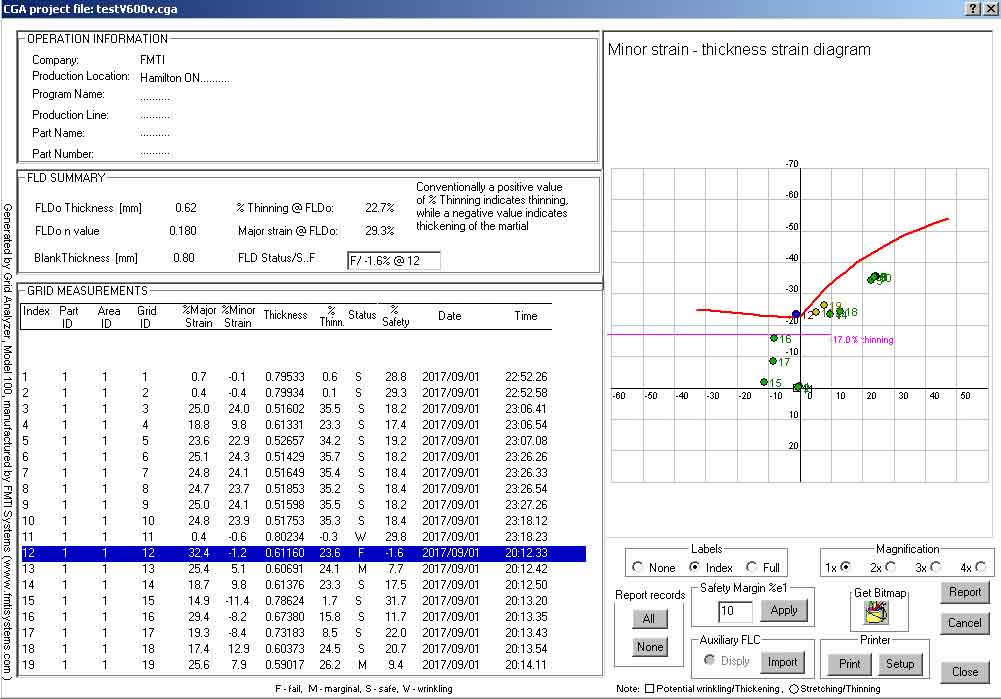
The strain analysis report provides a plot of the strains with reference to the forming limit curve, FLC expressed in the major-minor strains or thickness-minor strains coordinates.


Deformation Browser

Deformation Browser

Our unique Deformation Browser software tool designed for die tryout applications. This tool, in addition to detailed information pertaining to the measured deformation, generates a variety of animated graphical and numerical outputs representing cross-linked changes of the strain and stress state associated with moving a deformation point from where it is, to where the user would like it to be. Based on that information the user may evaluate the feasibility of these changes and their implementation in terms of the die geometry and sheet clamping conditions.

Polka Dot Grid Analysis (PDA) Option

Polka Dot Grid,forming limit diagram, FLC,forming severity,surface strain,stress limit diagram,rolling direction,strain of sheet metal,analysis of deformation,strain analysis report

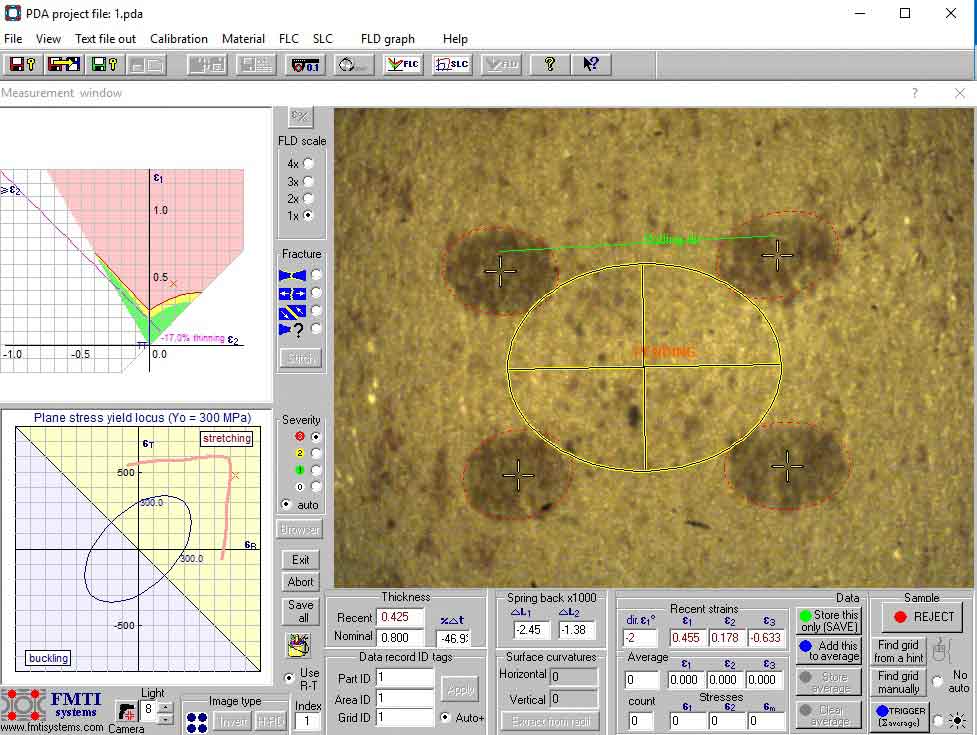
The Polka Dot Analysis (PDA) option is included with Model 200P only. It employs the three and four dot Polka Dot grid pattern, which is used by some commercial three-dimensional deformation measurement systems, such as the Phastâ„¢. The FMTI PDA option, provides industrial users of the three-dimensional PD grid analysis systems with a quick and accurate single grid element measurement tool in two dimensions, capable of overriding the automated measurements with direct user input. The PD grid pattern is especially suitable for the analysis of deformation localized to a small area, in such operations as hemming, flanging or in the weld zone on parts produced from laser welded tailored blanks or tubes.

SGA2x Option

SGA2X

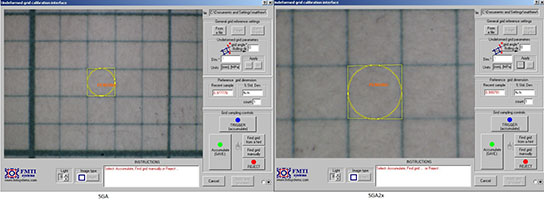
The FMTI Grid Analyzer Model 200 option SGA2x targets surface strain measurement based on the digital image analysis by employing a square grid with an approximate size of 1 mm. In comparison with the normal 2.5 mm grid, the 1 mm square grid is more suitable for surface strain measurements in sheet metal forming operations involving deformation localized over a small area such as occurs when wrapping a sheet over a sharp radius, hemming, etc. 


slide up button